
Enterprise data platform use cases across 8 sectors
Published October 22, 2026 · Abu Dhabi
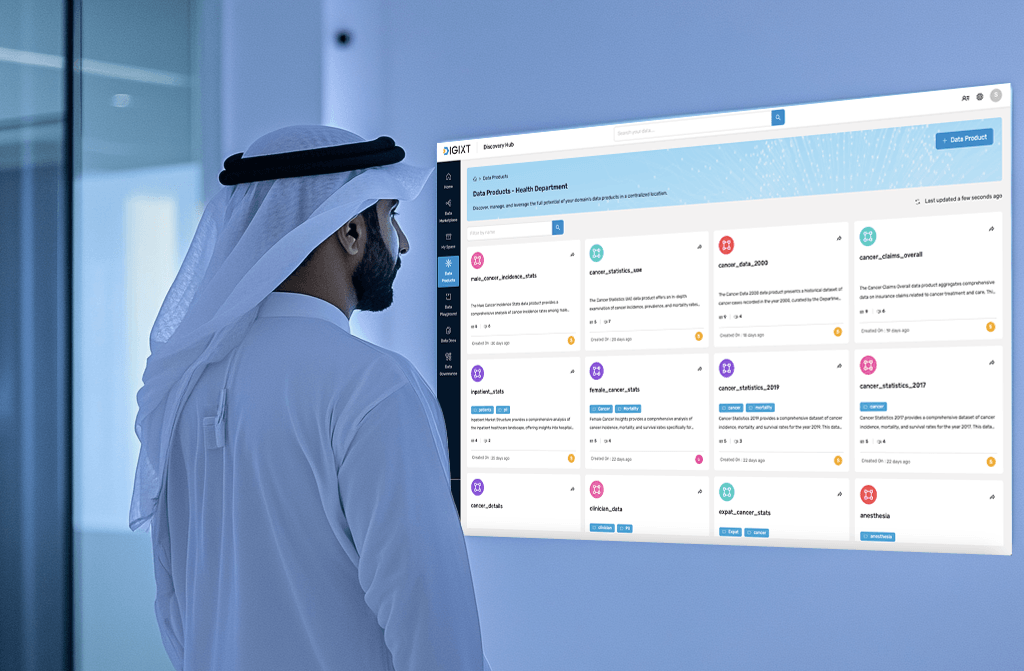
DigiXT Data Platform is an enterprise big data platform for integrating, processing and analyzing data at scale. Sector use cases where live, connected and predictive data changes how governments, defense organizations, institutions and enterprises operate.
Overview
DigiXT Data Platform is an enterprise big data platform for integrating, processing and analyzing data at scale. Below are sector use cases where live, connected and predictive data changes how governments, defense organizations, institutions and enterprises operate.
The portfolio covers 46 use cases across 8 sectors: Government, Defense, Education, Healthcare, Investment Companies, Conglomerates, Retail and Real Estate.
Government
Real-Time Traffic and City Flow Management
Live feeds from road sensors, traffic cameras and GPS devices are analyzed to detect congestion forming up to 45 minutes ahead. Signal timings are adjusted automatically, cutting commute times, fuel waste and emergency response delays.
Public Benefits Fraud Detection
Tax, housing, employment and social-support records are linked across departments to expose claims that fall between the gaps. Officials receive a prioritized list of suspicious cases, recovering public funds that would otherwise be lost.
Predictive Maintenance of Public Infrastructure
Sensors on bridges, pipelines and roads report structural condition continuously. Failure is predicted well in advance, so maintenance crews are dispatched at the right moment instead of paying for emergency repairs after a collapse.
Citizen Service Demand Analytics
Every helpline call, office visit and portal session is captured and analyzed to reveal which services are in demand, when and where. Managers staff peak periods correctly and redesign the digital journeys citizens struggle with.
Tax Revenue Forecasting and Evasion Scoring
Economic activity, filing history, property registrations and business data are combined to forecast monthly tax revenue. Each taxpayer is scored for under-reporting risk, so auditors focus on cases most likely to yield results.
Emergency Dispatch and Multi-Agency Coordination
When an incident is reported, location, nearest available crews, road conditions and weather are evaluated instantly to find the fastest route. During major disasters all agencies share one live map, and every response is reviewed afterwards.
Evidence-Based Policy Impact Measurement
Data from schools, hospitals, employment offices and housing is linked to show the measured effect of a law or program. Officials see how many participants of a training scheme found work and how earnings changed, and fund what works.
Defense
Unified Battlefield Situational Picture
Drone, satellite, ground-patrol and signals data arriving in different formats is fused into one continuously updated operational map. Significant changes on the ground are highlighted automatically so commanders miss nothing critical.
Fleet Readiness and Predictive Maintenance
Engine and component sensors on aircraft, ships and armored vehicles are monitored continuously. Likely failures are flagged before they happen, reducing unexpected breakdowns, downtime and repair costs across the fleet.
Military Supply Chain Assurance
Every item is tracked from factory to front line and future demand is predicted from how operations are progressing. Struggling suppliers or blocked routes are flagged early so alternatives are arranged before a shortage occurs.
Personnel Readiness and Skills Forecasting
A live view of every individual's qualifications, medical status and assignment lets planners assemble the right team for any mission quickly. Future shortages in critical skills are predicted, giving time to train before gaps appear.
Mission Simulation and Course-of-Action Analysis
Mission plans are run through simulations built from real terrain, weather and adversary data. Multiple scenarios are played out to show which approaches carry the most risk and which are most likely to succeed before any resources are committed.
Education
Early Identification of At-Risk Students
Attendance, grades, online participation and other signals are analyzed together to spot students at risk of failing or dropping out weeks before a teacher would notice. Counselors intervene early, when problems are easier and cheaper to fix.
Personalized Learning Pathways
The platform tracks which concepts each student has mastered and which remain difficult, then recommends the right exercises and lessons for that individual, replacing one-size-fits-all homework with material matched to each learner.
Enrollment Forecasting and Capacity Planning
Application trends, local population data and economic conditions are used to forecast enrollment per program for the coming years, so institutions hire the right number of teachers, avoid overcrowding and decide which courses to open or close.
Secure Research Data Management and Collaboration
Experiments, surveys, clinical studies and publications are stored in one secure environment where researchers across departments and countries collaborate. Citation and real-world impact are tracked to guide funding decisions.
Graduate Employment Outcome Analytics
Graduate employment results are tracked and compared with employer skill demands. Programs whose graduates struggle to find work are identified, and the data shows exactly which parts of the curriculum need updating.
Smart Campus Safety and Facilities Monitoring
Security cameras, door-access logs and building systems are monitored together. Unusual events such as a forced door at night or a failing boiler trigger immediate alerts, and space-utilization analytics guide maintenance and facility investment.
Healthcare
Point-of-Care Clinical Decision Support
A patient's full history, test results and medications are assembled instantly and checked against current clinical guidelines. Dangerous drug interactions are flagged before a prescription is finalized, and imaging analysis helps detect early-stage disease.
Early Disease Outbreak Detection
Unusual rises in emergency visits for fever or pharmacy sales of cough medicine are detected as they emerge. Health authorities receive an early warning for a specific area, with time to deploy vaccines, issue alerts and prepare hospitals.
Patient Flow and Capacity Optimization
Daily patient arrivals are forecast from season, weekday and historical patterns so beds, nurses and doctors are arranged in advance. Patients who are ready for discharge but waiting on a process are identified to free beds sooner.
Accelerated Drug Discovery and Trial Recruitment
Vast scientific datasets are processed far faster than manual review, identifying promising compounds and matching eligible patients to clinical trials. Life-saving treatments reach patients sooner at lower development cost.
Medical Claims Fraud Prevention
Every claim is checked against normal billing patterns for that type of provider. Treatments never delivered or procedures billed above what was performed are flagged for review before payment, stopping fraud at the source.
Hospital Readmission Risk Prediction
At discharge, each patient is scored for the likelihood of returning within 30 days based on condition, home situation and medication adherence. High-risk patients are flagged for a follow-up call or home visit, preventing costly readmissions.
Pharmaceutical Stock and Cold-Chain Management
Medicine stock across hospitals is tracked, future demand is predicted from patient numbers and seasonality, and purchase orders are raised automatically. Temperature-sensitive products such as vaccines are monitored from manufacturer to patient.
Investment Companies
Real-Time Investment Decision Support
Live market prices, economic news and historical patterns are processed simultaneously to guide what to buy or sell and when. Portfolio concentration is checked continuously and rebalanced automatically within defined limits.
Firm-Wide Risk Exposure in Near Real Time
Total exposure across hundreds of positions in multiple countries is calculated continuously. Risk managers are alerted when exposure exceeds policy limits, replacing overnight batch calculations that revealed risk only after the damage was done.
Automated Regulatory Reporting
Trade, counterparty and risk-position data required by regulators is gathered from every system automatically and formatted for each authority. Reports that once took teams days to compile are produced in minutes with fewer errors.
ESG Scoring and Impact Reporting
Sustainability data is collected for every company in the portfolio and consolidated into a clear ESG score. Pension and sovereign wealth clients receive reports showing exactly how their money is invested and the impact it has.
Client 360 for Wealth Management
Everything known about each client is unified so advisers can act at the right life moment. A client who has just sold a business is contacted proactively with reinvestment options before approaching a competitor.
Conglomerates
Group-Wide Performance Dashboard
Performance data from manufacturing, retail and financial-services subsidiaries running separate systems is consolidated into one live dashboard. Group leadership compares every business immediately instead of waiting for monthly reports.
Group Supplier Risk Monitoring
Every supplier used across the group is mapped, revealing shared dependencies that individual businesses did not know existed. News and financial signals are monitored for early warning so procurement finds alternatives before a crisis.
Acquisition Due Diligence and Synergy Tracking
Large volumes of documents, financial records and operational data from an acquisition target are analyzed rapidly, surfacing risks and opportunities in days rather than weeks. After the deal, expected benefits are tracked against reality.
Transparent Shared-Services Cost Allocation
Actual usage of shared IT, HR, legal and finance services by each business unit is measured precisely. Transparent allocations replace disputed estimates, ending the perception that shared services are charged unfairly.
Single Customer View Across Group Brands
A customer who shops at a retail brand, uses the financial-services arm and stays at a group hotel is recognized as one person. Coordinated loyalty benefits reward the most valuable customers who spend across multiple businesses.
Data-Driven Capital Allocation
Return on capital is measured consistently for every business, and the effect of moving investment from one unit to another is simulated. Decisions that were driven by internal politics are replaced with evidence.
Retail
Demand Forecasting and Automated Replenishment
Sales of every product in every store are forecast for the coming days and weeks, accounting for promotions, local events and the weather. Replenishment orders are triggered automatically so shelves stay stocked without overloading warehouses.
Personalized Offers from a Unified Customer Profile
Purchase history, browsing behavior, loyalty activity and past offer responses are combined into one profile per customer. Marketing sends recommendations that match individual preferences instead of generic promotions.
Dynamic Pricing and Markdown Optimization
Competitor prices are monitored continuously and combined with stock levels and sales targets to recommend the optimal price for each product. As seasonal lines near the end of their window, targeted markdowns clear stock without giving away margin.
Marketing Attribution and Spend Optimization
Spend on TV, social media, email and in-store promotions is analyzed against actual sales to show which channels deliver a return. Budget shifts toward what works, making every marketing dollar work harder.
Shrinkage and Checkout Fraud Detection
Sales data, stock counts and CCTV analysis are combined to pinpoint the stores, categories and shifts where losses are highest. Unusual checkout patterns, such as excessive refunds by one employee, are flagged for investigation.
Store Layout and Staffing Optimization
Foot-traffic patterns, dwell time per aisle and placement-to-purchase data reveal which layouts sell more. Staffing is matched to peak hours so checkout queues stay short without overstaffing quiet periods.
Real Estate
Automated Property Valuation
Recent sales, rental trends, location scores and upcoming infrastructure projects are combined to value properties automatically and continuously. Banks use it for mortgage approvals and funds monitor hundreds of assets without individual surveys.
Portfolio Performance and Disposal Timing
Income, costs and value of offices, warehouses and retail units across countries are consolidated so fund managers see which assets outperform and which lag. The best time to sell each property is modeled against market conditions.
Smart Building Energy and Maintenance Optimization
Occupancy, temperature, air-quality and energy sensors drive automatic adjustment of heating, cooling and lighting so empty floors are never conditioned. Lift and HVAC failures are predicted and fixed before they disrupt tenants.
Construction Cost and Schedule Control
Cost data, contractor schedules, material deliveries and site progress are connected into one view so delays and overruns are visible as they begin. Data from completed projects produces more realistic budgets and timelines for new ones.